The Analytics Implementation Toolbox
For analysts & developers, there are some great resources out there that dive into basics of building good reports & dashboards (for analysts) and facilitating scalable & effective data architecture (for developers). However, in the niche of analytics implementation, some of these resources aren’t targeted enough, or aren’t user friendly enough without getting too deep into the weeds.
What I wanted to do with this post is provide some good all-purpose tools & resources focused specifically on “Analytics Implementation”, and provide a toolkit / resource list that has been hugely beneficial for me in my career in digital analytics, in hopes that you might find it useful as well!
Tag Management System (TMS)
The most commonly used method of implementing analytics tagging on a website is through the use of a tag management system, or TMS. It’s no surprise that two of the biggest analytics players out there both have a very heavily adopted TMS platform: Google Tag Manager (GTM) for Google Analytics and Adobe Experience Platform Data Collection Tags (formerly / still commonly known as ‘Launch’) for Adobe Analytics.
At it’s most basic breakdown, a TMS is a JavaScript library that is deployed via an embed script on the site you wish to track that allow for adding “tags” without a need to update the script each time you make a change. ObservePoint has a great blog post about some of the big players in the TMS space and what type of TMS is best for you to use based on your needs, but for most of us in the field, we have primarily interacted with either GTM or Launch (or it’s predecessor, DTM).
At this point in time, if you are attempting to implement analytics on a website WITHOUT a tag manager but instead through directly adding code, you are likely hindering your ability to scale and apply good governance with your tagging (i.e., preventing duplicate tags from firing, allowing quick updates when needed, and allowing for clear ownership / transferability of tags created).
Recommendations
Unless you have a use case that requires a paid tag management system, my recommendations for users who are determining a tag management solution are vendor specific since in both cases they are included as part of an analytics package
- Adobe Analytics: Adobe Experience Platform Data Collection Tags
- Google Analytics: Google Tag Manager
Debugging & Troubleshooting
Viewing Beacons Directly
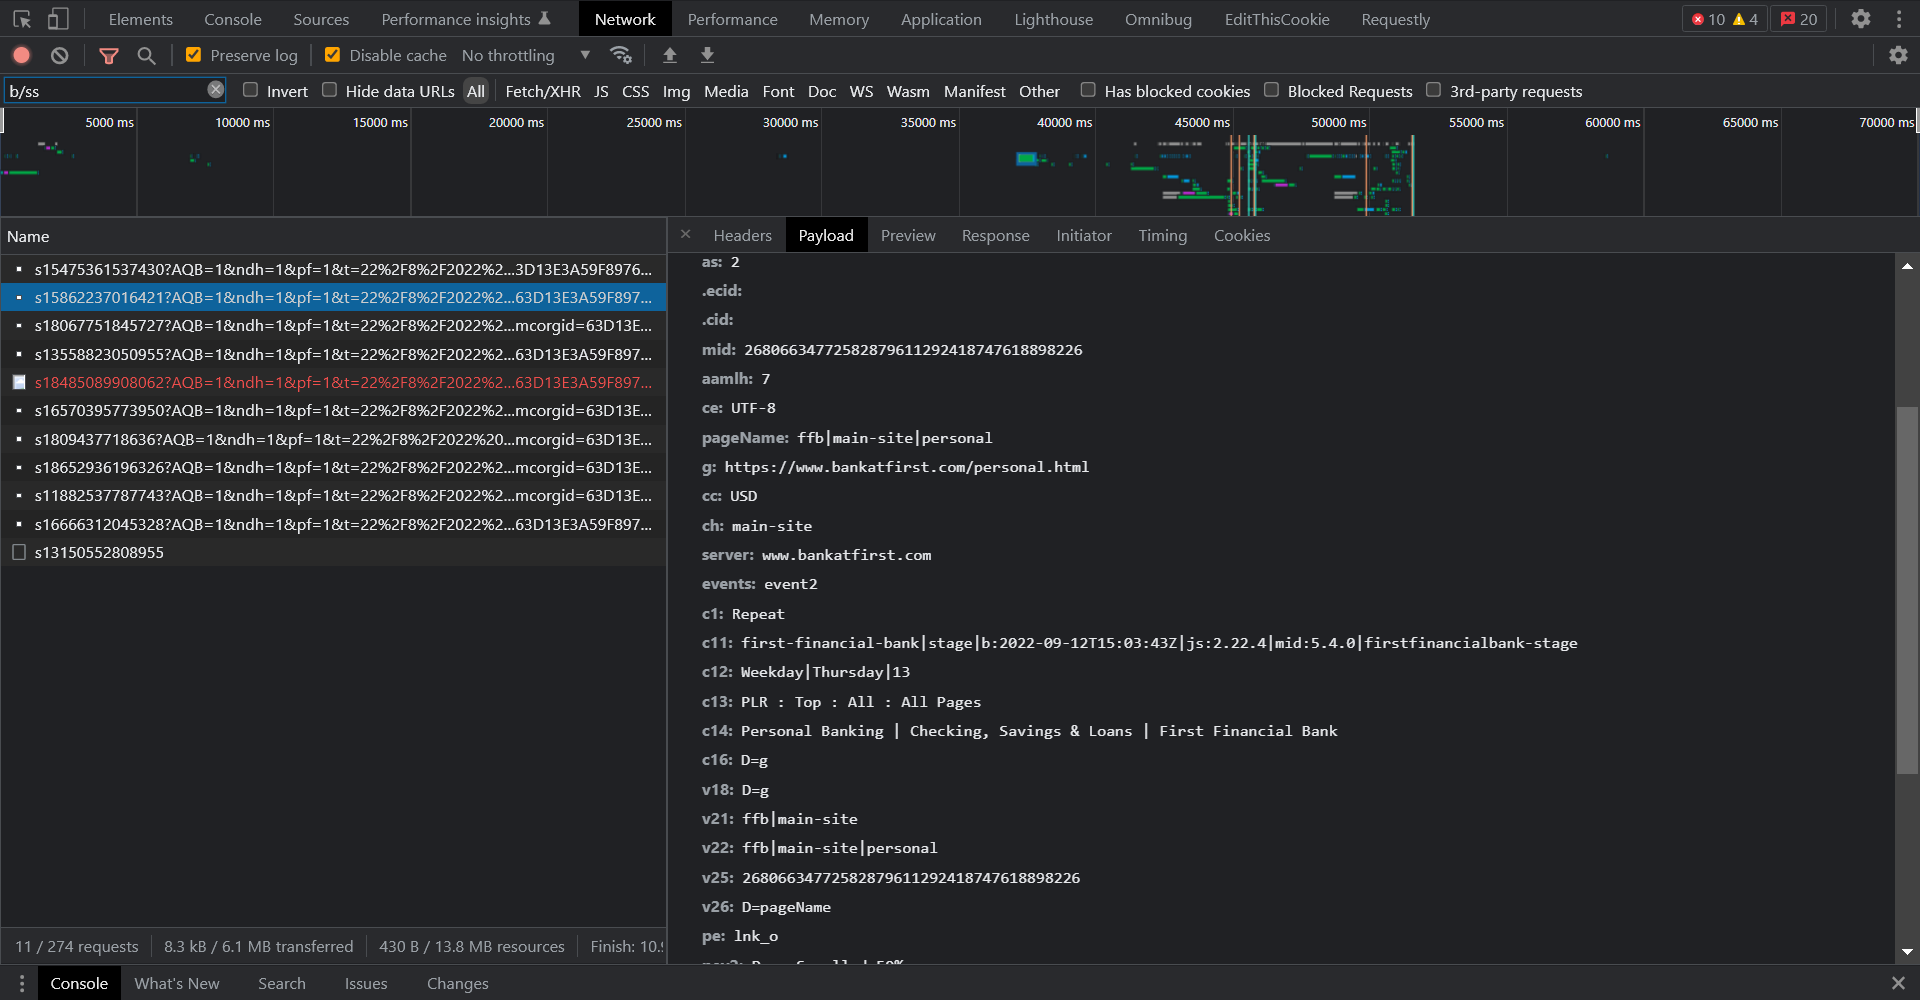
One of the major areas where debugging for implementation focused professionals as opposed to analysts differ is in where we start our debugging process. While some analysts may actually review on-page to see when a beacon may fire, all implementation specialists (should) start with looking at the initial beacon when reviewing & testing their implementation. It is technically a complete possibility to rely entirely on Chrome debugging tools / developer console, switch to the “network” tab and review each network call individually. However, it’s not the most friendly on the eyes…
Recommendations
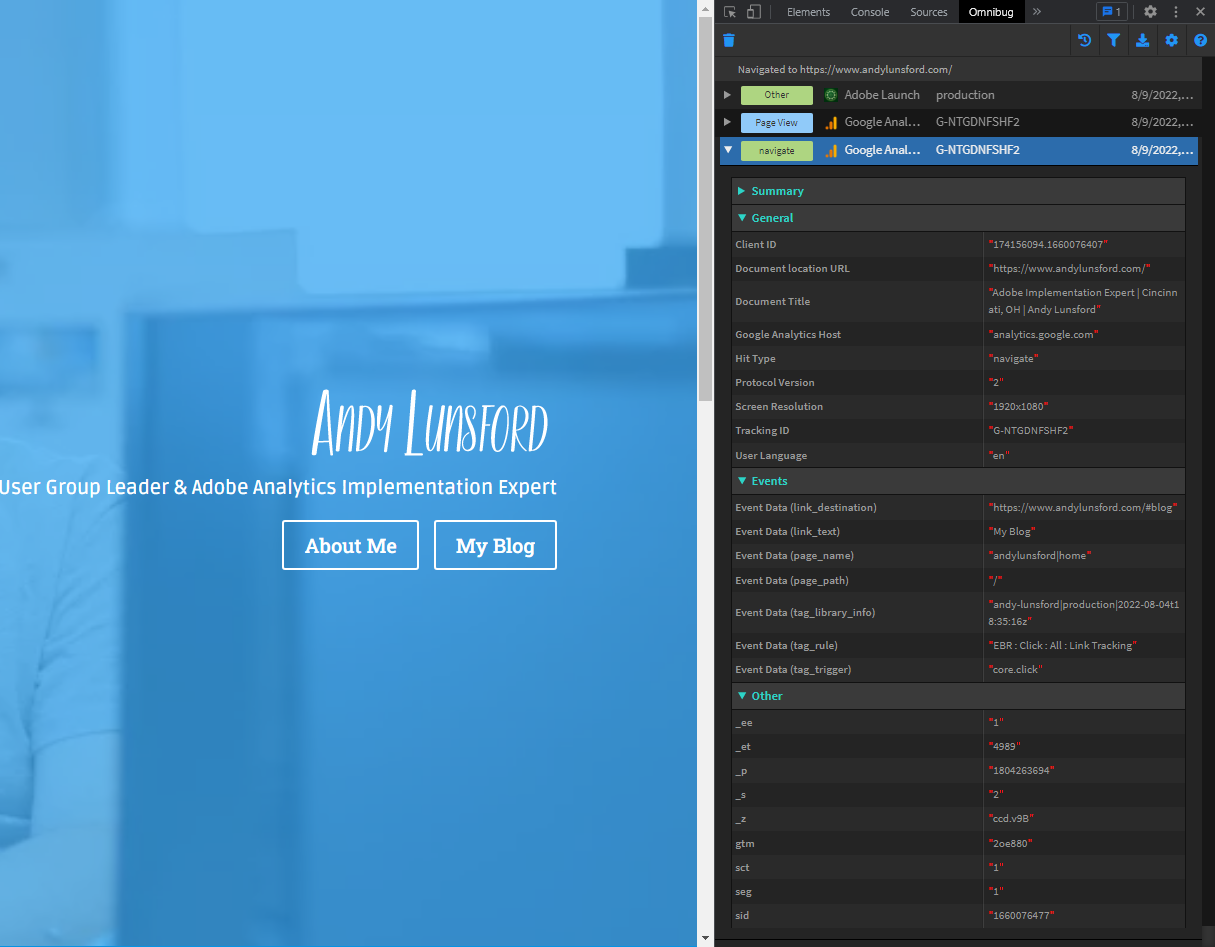
When debugging multiple vendors / tags, Omnibug is quite possibly the most versatile cross-platform browser extension. Being able to see all the vendors tags that load, and filter them out (even by account name!) with a bit of color in your browser’s developer tools is amazing! The settings allow you to highlight certain fields if you’re monitoring a particular attribute, and even to add descriptions to eVars & props via a JSON file if you want the report names when your debugging. Plus, the ability to force a view on only a specific vendor / group of vendors at a time & save as a default view is fantastic if you’re doing targeted work on only floodlight tagging, or a specific analytics platform when multiple types of remarketing are firing at once.
The Adobe Experience Platform Debugger & Google’s Tag Assistant are great options for their respective platforms, with AEP Debugger being the more powerful of the two regarding support for all potential Adobe tools you might be using, but I do find it more intensive on memory than Tag Assistant (likely due to all the wonderful stuff it’s doing and storing of logs without requiring opening the developer console). The obvious limitations of both of these tools is if you’re not fully committed to either the Adobe or Google technology stack for your data collection, either of these tools will only serve a portion of your debugging. There are pros and cons to using multiple tools in your testing, but I do find myself relying on these three tools the most to debug beacons.
Another great solution for debugging (and for a few other functions that we’ll dive into later) that is cross-platform is Charles Proxy, and it is our first paid tool so far in our blog. Love it or hate it, it’s cross-platform, allows for mobile debugging of native apps, and fits in with our solutions where there’s no really easy way to view beacons in a standardized format (looking at you, Safari…), but there’s a LOT to cover with this tool. I’ll link to Jennifer Kunz’s post on it from her blog, as she walks through some good solid basics with it, the biggest advantage with using it is that regardless of the method the beacon is sent with, you are monitoring the packets, and can capture any / all beacons.
Library Testing
In a perfect world, you have a unique development environment lined-up for all analytics changes & tagging you want to build / review, each library of your script can be loaded for any environment without issue, and you can even test injecting scripts on environments to see what analytics capture may look like before it’s actually installed! However, the truth of the matter is that most of the teams doing work for analytics tagging are different from the teams deploying functional features that the tagging is done on, and you are at the mercy of your development team to install your script for testing… or are you?

Recommendations
Our first friend we will revisit is Charles Proxy, as not only is this tool great for debugging across multiple platforms, but the rewrite functionality will allow us to force all devices connected through Charles Proxy to use a different library (i.e., loading a test analytics library in production to verify a fix), or to even load a line of script in altogether!
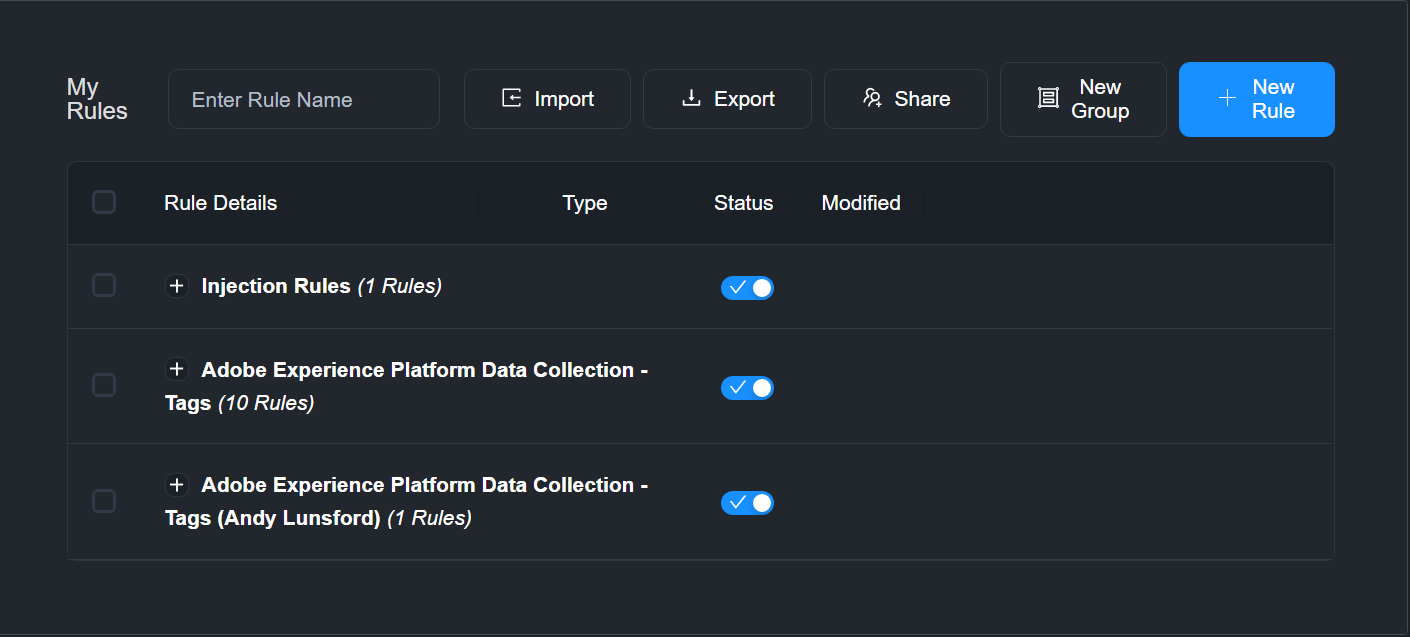
Analytics Demystified has a great intro guide on the capabilities with this functionality in their blog, but I will fully admit that it can sometimes be tricky to add new rules & manage inside Charles’ interface, especially if you are dealing with a network proxy at your office. Luckily there is a tool that I utilize even more than Charles Proxy that is absolutely fantastic for both injection of a library and modification of library URLs.
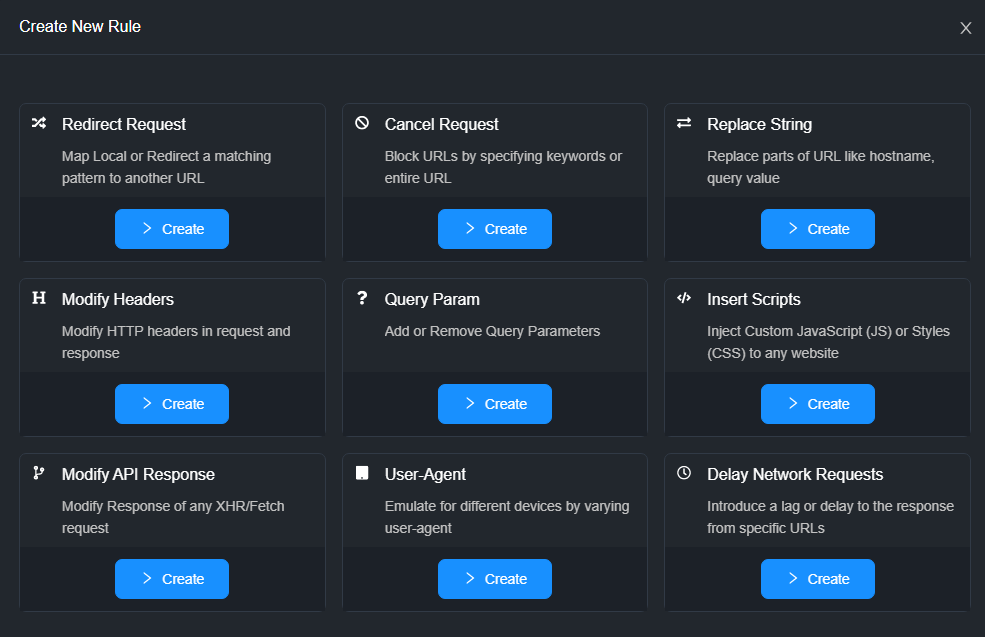
If you’re testing certain functionality such as error messages, user-agent differences, or are working with CORS issues that are currently waiting on IT assistance to resolve with external vendors, there is a rule category to handle / emulate these conditions without having to turn on throttling / work with breakpoints in the browser. I mean, look at these types of rules that exist out of the box!
Sure, but not nearly as simple to configure as it is here, and for organizations that have limited access to admin on their workstations, you’re much more likely to get a chrome extension added than get Charles Proxy cleared quickly. I think there are some benefits that make downloading the desktop application a great idea as well, but as a worst case scenario, you can get up and running in the browser within 5 minutes potentially. I can not say the same for Charles Proxy in any situation, even on my personal machine.
Miscellaneous
Outside of the above tools, I love using RegExr for my regular expression work when building custom code tagging as a nice handy cheatsheet and for highlighting potential problems (I’m looking at you Apple, with your lack of support for lookbehind in Safari!). I also use Visual Studio Code for writing snippets and validation of code before copying / pasting into GTM or Launch, as I’ve been burned too many times with internet connection dropping when saving a rule / tag or custom code data element, or leaving a browser window open and timing out. Plus formatting & validating your JavaScript / HTML is much easier in a code editor!
And finally, EditThisCookie. Great way to see what cookies are being set, and to modify data in them in a much easier way then loading all cookies in the console, since we’re still not fully migrated to the new cookieless future yet.
This is by no means an exhaustive list, and speaking with my colleagues, I already realized there are a few I’m forgetting, but definitely let me know what tools you think should be included in a future list / update!


